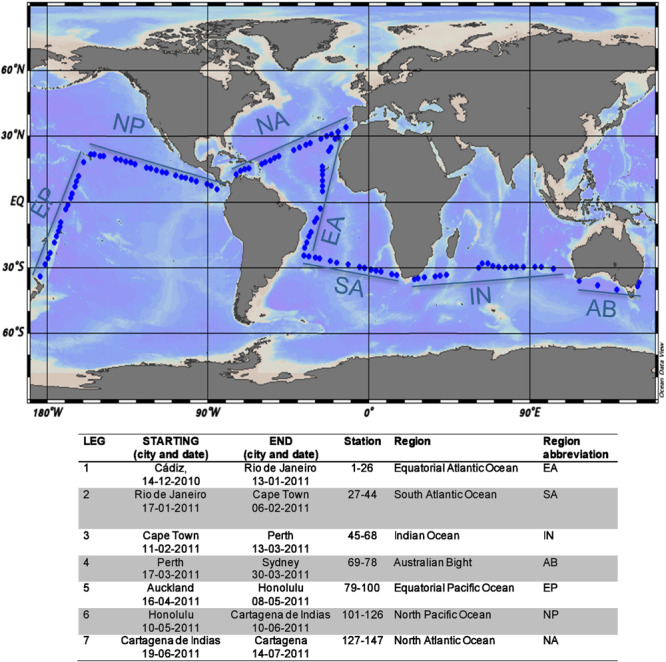
FIGURE 1.

Map showing the sampling stations across the tropical and the subtropical ocean, indicating the different oceanic regions (Ocean Data View; Schlitzer, 2013). Dates and start and end locations, stations, and regions covered during each leg are provided in the table below. Region delimitation as in Pernice et al. (2015).
