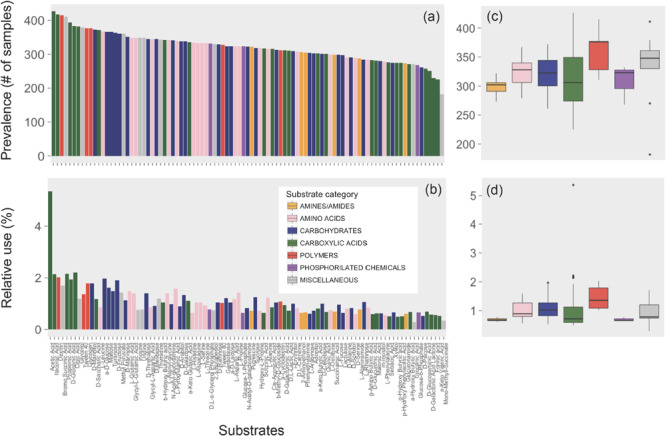
FIGURE 2.

Prevalence (number of samples in which a given substrate was used) and mean relative use (absorbance of each substrate relative to the total absorbance of the sample) of the 95 substrates individually (a,b) or grouped by category (c,d). The colors indicate different categories (see Supplementary Table S3). Boxplots represent median, first, and third quartiles and 1.5 × interquartile range (whiskers). Points beyond the end of the whiskers are outliers.
