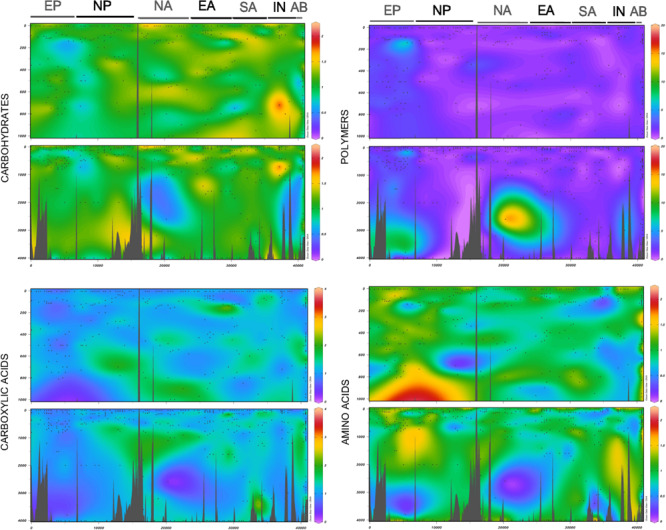
FIGURE 4.

Relative use of different substrate categories along the entire expedition as visualized with Ocean Data View (Schlitzer, 2013). The different oceanic regions (see Figure 1 for descriptions) are indicated at the top of each graph and are ordered as in the map (Figure 1). Small dots indicate the sampling points. The upper panels show the upper part of the profile until 1,000 m, where higher-resolution profiles were performed, and the lower panels represent the entire profile from the surface until 4,000 m.
