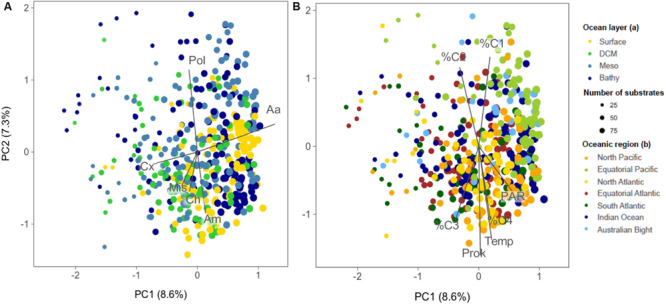
FIGURE 5.

Principal component analysis (PCA) ordination of samples based on the functional structure of prokaryotic communities. The samples are labeled according to oceanic layer (A) or region (B). The dot size is proportional to the number of substrates used per community. The vectors indicate the main substrate categories in (A) and the environmental variables that significantly fitted the ordination space in (B) (using the R envfit function). The size of the vector is proportional to the strength of the linear relationship of each variable. The first two PCA axes explain 16% of the variance. Pol, polymers; Aa, amino acids; Cx, carboxylic acids; Ch, carbohydrates; Am, amides/amines; Mis, miscellaneous;%C1, %C2, %C3, and %C4, percentage contribution of the fluorescent parallel factor analysis components C1, C2, C3, and C4 to the total DOM fluorescence; Temp, temperature; Prok, prokaryotic abundance; PAR, photosynthetically active radiation.
