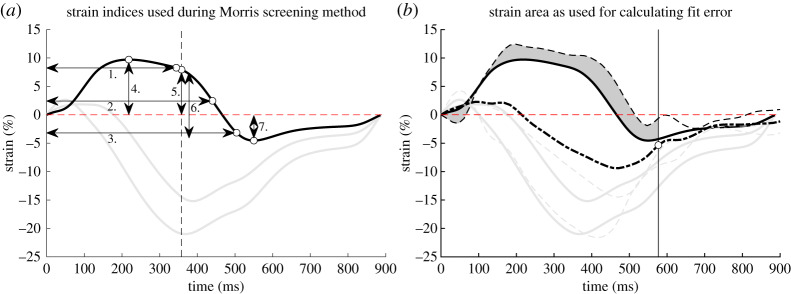
Figure 2.
(a) Strain indices for one strain curve as used in the MSM. The same indices are included for the three RVfw segments, as well the LVfw and IVS segment. The indices are time to 10%, 50% and 90% shortening (1,2,3), pre-stretch (4), systolic strain (5), post-systolic strain (6) and peak strain (7). The verticle dashed line indicates closure of the pulmonary valve. (b) An area is used to calculate the fit error. The area is defined from onset of QRS to 50% relaxation (the white dot with the vertical line) of the global RVfw strain (thick dashed line) and is calculated for all three RVfw segments, as well the LVfw and IVS segment. For the actual fit error, the area for all three RVfw segments, LVfw segment and IVS segment is included. (Online version in colour.)

