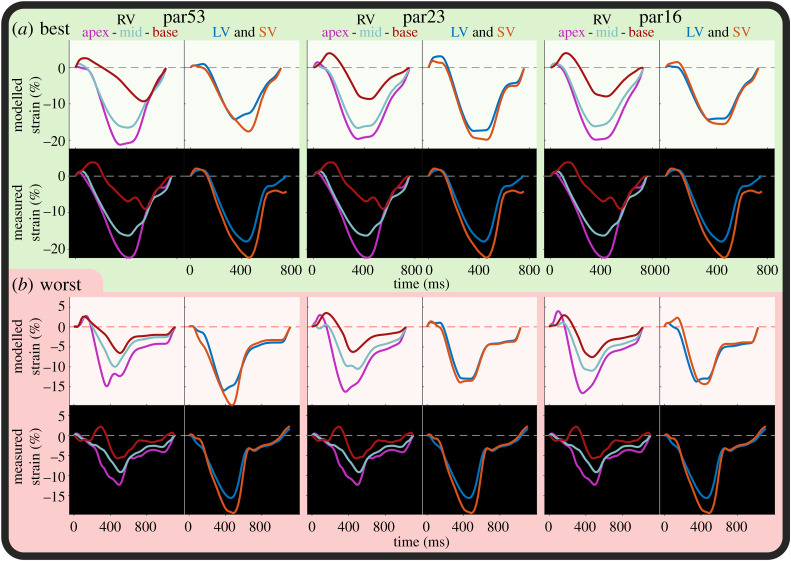
Figure 4.
Example fits from PSO of par53 (left), par23 (middle) and par16 (right) of the best fit ((a); subject 12) and worst fit ((b); subject 14) of subjects with abnormal strain. For subject 12, the summed squared error was 8.2, 13 and 17 for par53, par23 and par16, respectively. For subject 14, the summed squared error was 14, 30 and 37, respectively. (Online version in colour.)

