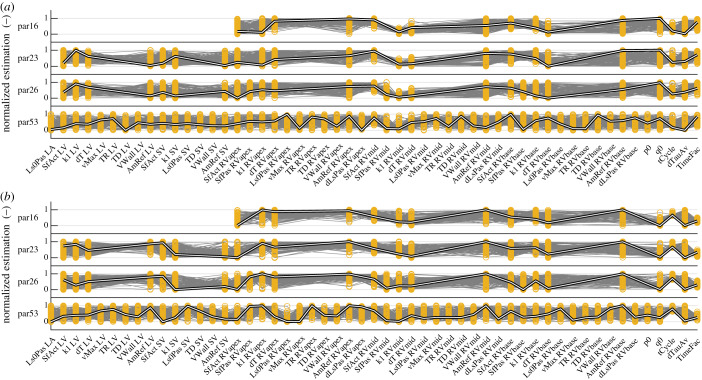
Figure 5.
Normalized estimations resulting from qMC and PSO of subject 12 (a) and subject 14 (b) of the subset with 53, 26, 23 and 16 parameters (par53, par26, par23 and par16, respectively). Included parameters are indicated by the yellow bars. The best 100 simulations from qMC are shown in grey, the global optimum from PSO is shown in the thick black–white line. (Online version in colour.)

