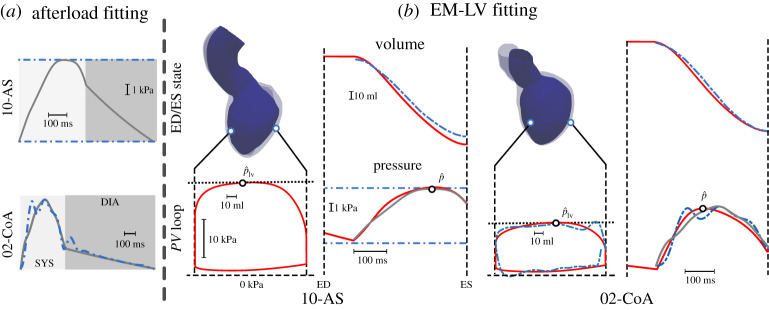
Figure 2.
Results of (a) afterload fitting and (b) EM LV fitting for cases 10-AS and 02-CoA. (a) Fitted and measured pressure traces are drawn as solid grey and dashed-dotted blue traces, respectively. In case 10-AS only discrete pressure values were available (dashed-dotted blue). (b) PV loops simulated with the EM LV are shown over a full cardiac cycle, whereas the resulting LV volume and aortic pressure traces are shown only during ejection. Traces refer to EM LV simulation (solid red), measurements (blue dashed-dotted) and results of the afterload fitting, computed by solving the Wk3 equation (2.1). Gap in IVC phase of measured PV loop for the 02-CoA case can be explained by the low sampling resolution causing Vlv, m to be not completely periodic. End-diastolic (ED, transparent) and end systolic (ES, solid blue) configurations of the LV are also shown. (Online version in colour.)

