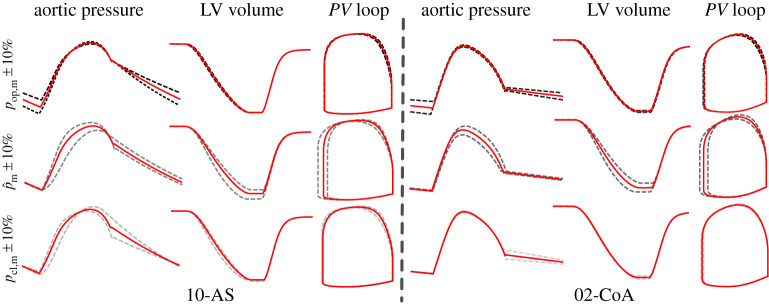
Figure 4.
Effect of Wk3 parameter variability on physiological signal output of EM LV model. Pressure, volume and PV loops resulting from EM simulations with varied input parameters are shown for case 10-AS and case 02-CoA. Deviations due to changes in pop,m (dashed black), (dashed grey) and pcl,m (dashed light grey) are visualized along with initial results in solid red. (Online version in colour.)

