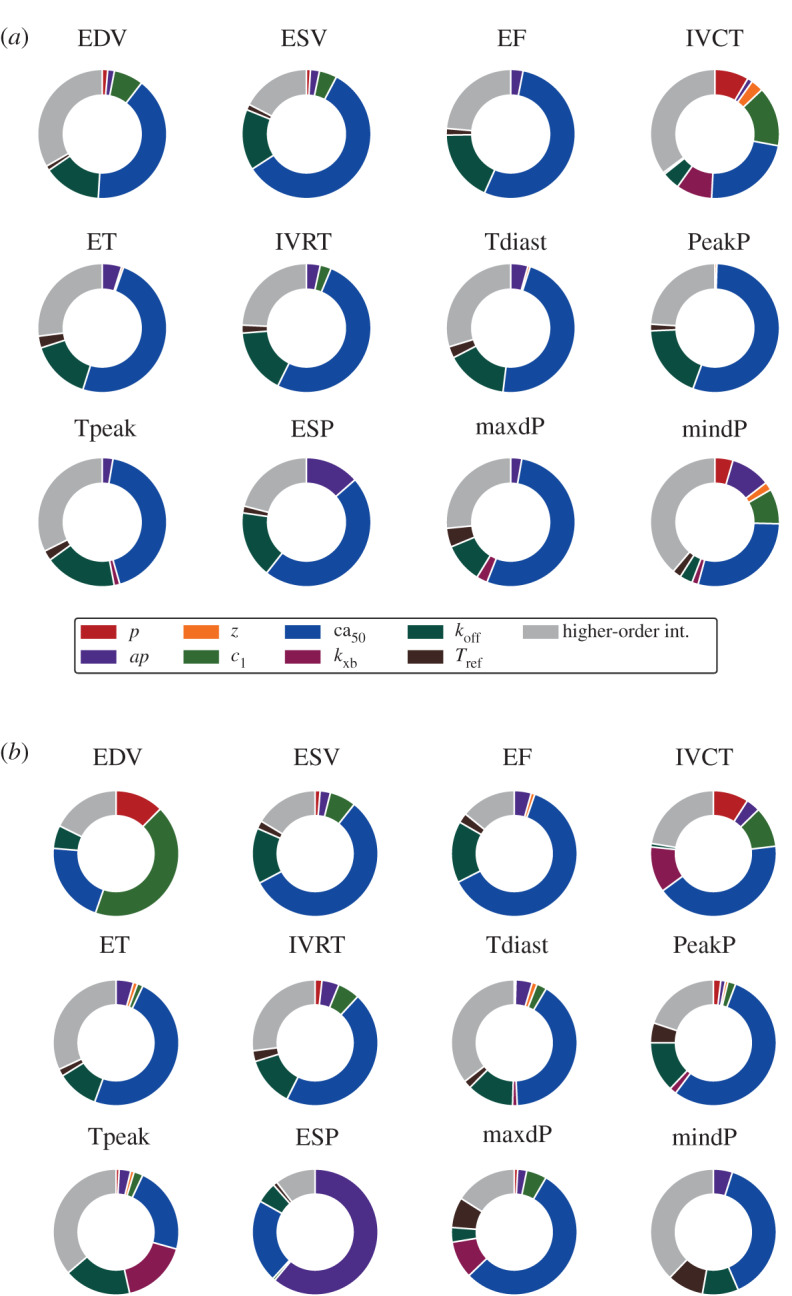
Figure 3.

The impact of cell, tissue and boundary conditions properties on organ-scale phenotypes in SHAM (a) and AB (b) models. The contribution of each parameter is represented by the sum of its first- and (when present) second-order effects. For each LV feature, higher-order interactions (coloured in grey) are represented by the sum of total effects minus the sum of all first- and second-order effects. Parameters’ and features’ labels are explained in tables 1–2. (Online version in colour.)
