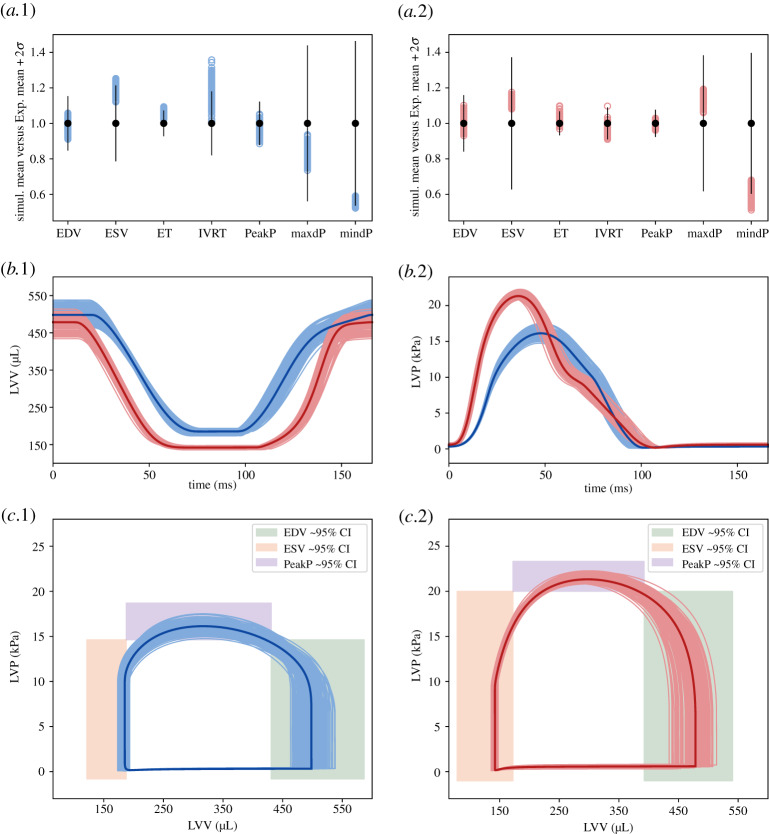
Figure 5.
Simulator runs using the HM last wave’s parameter points as an input. (a) Obtained LV features’ (empty, coloured dots) distributions around experimental mean values (filled, black dots) for SHAM (.1) and AB (.2). 2 SD confidence intervals are shown as vertical straight lines centred in their respective mean value. All the displayed values (including confidence intervals) are normalized by the respective experimental mean values. Features’ labels are explained in table 2. (b) Simulated LV volume (.1) and pressure (.2) curves which the features in (a) were extracted from, for SHAM (blue) and AB (red). The average curves are displayed in darker colour variant. (c) Resulting SHAM (.1) and AB (.2) pressure-volume loops with approximately 95% EDV, ESV, PeakP features’ experimental confidence intervals. (Online version in colour.)

