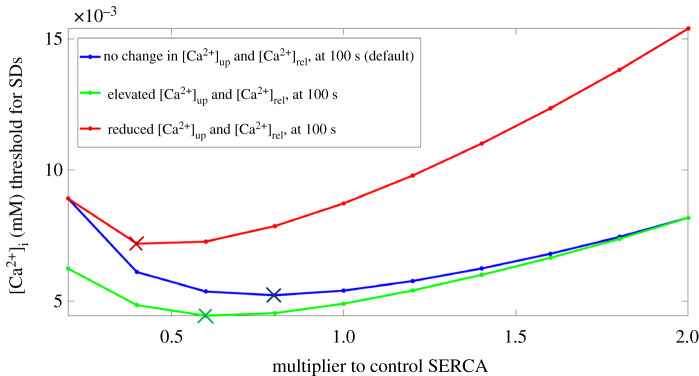
Figure 8.
The [Ca2+]i SD threshold for various levels of SERCA for three different cases. The default case is when no change was made to [Ca2+]up and [Ca2+]rel at 100 s into the simulation (blue). The other two cases are when at 100 s into the simulation, prior to intracellular Ca2+ injection, [Ca2+]up and [Ca2+]rel were elevated and reduced to their values at 200% SERCA (bottom) and 20% SERCA (top) at 100 s respectively in the default case (see electronic supplementary material, figure S4A and B). The coloured crosses indicate where a change in the trend occurs in the corresponding case. SERCA, sarcoplasmic reticulum Ca2+-ATPase; SD, spontaneous depolarization. (Online version in colour.)

