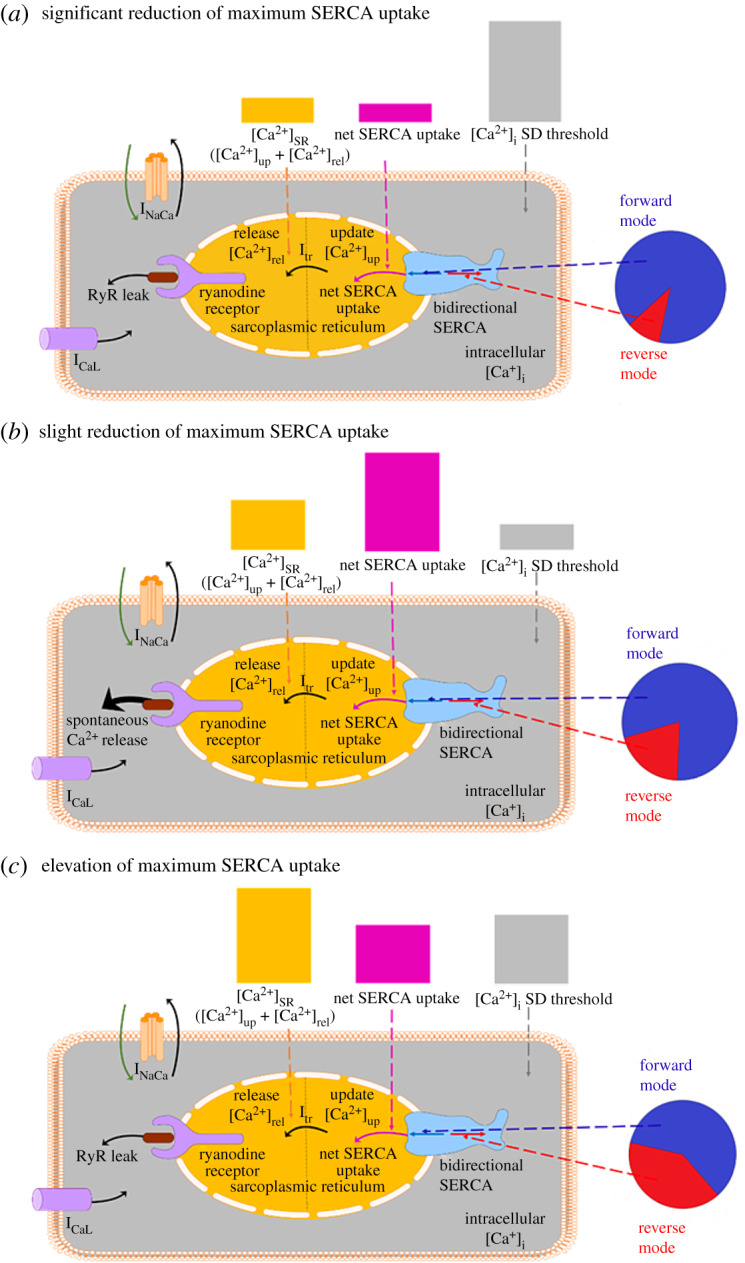
Figure 9.

Schematic illustrating the general differences in Ca2+ handling for maximum SERCA uptake ranges between (a) approximately 20–80% (b) approximately 80–100% and (c) greater than approximately 100% of its control value in the Maleckar et al. model. Pie graph inserts show the relative magnitude of the forward and reverse mode of the bidirectional SERCA pump in each range. Bar graph inserts qualitatively highlight the relative magnitude of the net SERCA uptake and [Ca2+]SR in each range, and how this impacts the magnitude of the [Ca2+]i threshold for SDs. SERCA, sarcoplasmic reticulum Ca2+-ATPase; SD, spontaneous depolarization. (Online version in colour.)
