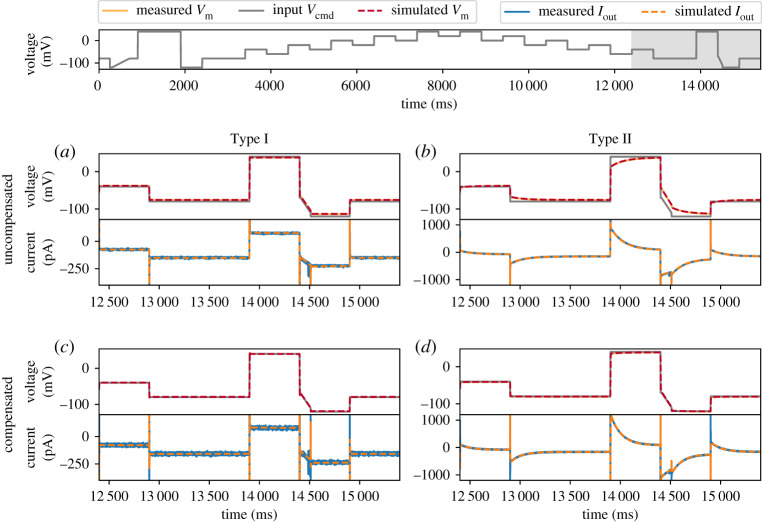
Figure 4.
Model simulations (dashed lines) using the amplifier settings compared against the simultaneous voltage clamp-current clamp measurements of the model cells (solid lines). Measurements are shown without compensation using (a) Type I Model Cell and (b) Type II Model Cell; and measurements with automatic amplifier compensation for Voff, Cp, Cm and Rs with α = 80% using (c) Type I Model Cell and (d) Type II Model Cell. All command voltages were set to be the staircase voltage protocol [14] (top panel); here only the last 3 s of the measurement is shown, the whole trace is shown in the electronic supplementary material, figure S4. In the top panel of each subfigure, the grey lines represent the command voltage Vcmd, and the orange/red lines represent the membrane voltage Vm; the bottom panel shows the current readout via the voltage-clamp, Iout. (Online version in colour.)

