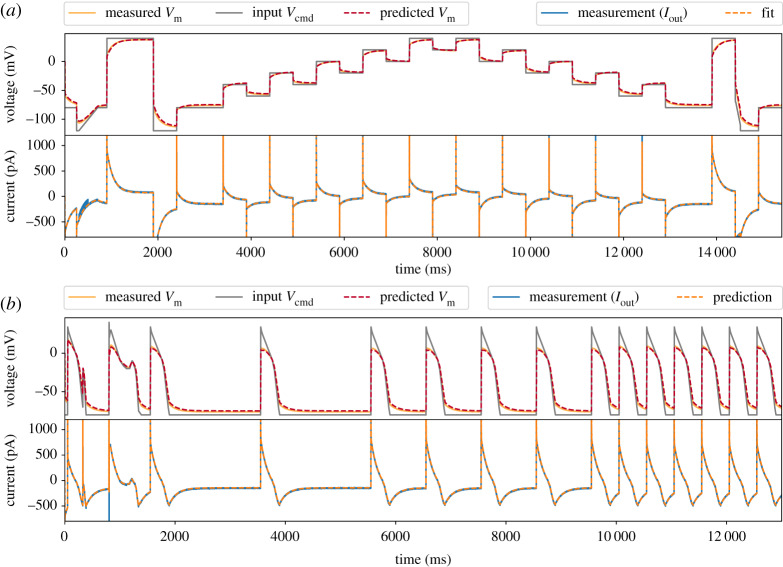
Figure 5.
Inferred model simulations and predictions (dashed lines) compared with experimental data (solid lines) from a Type II Model Cell. (a) Model calibration with a staircase protocol (grey lines in the top panel), where the model was fitted to only the current recording (blue, solid line in the lower panel). The fitted model was able to predict the membrane voltage, Vm (orange, solid line) measured using current-clamp. (b) Further model validation using an independent voltage-clamp protocol, a series of action potentials (grey lines in the top panel). Again, predictions from the model fitted to the staircase protocol above (dashed lines) are excellent for both the current and the membrane voltage. (Online version in colour.)

