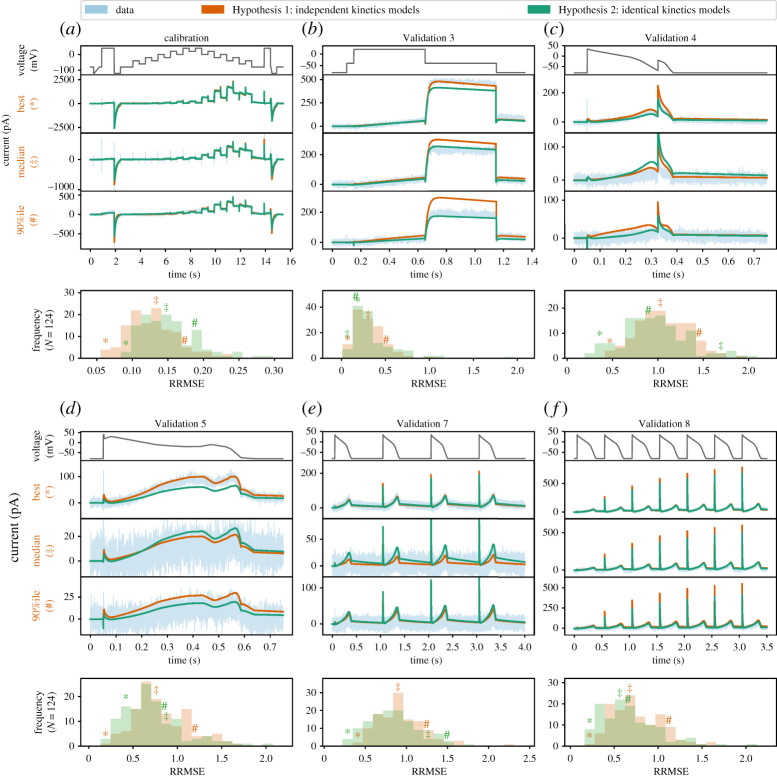
Figure 7.
The relative root mean square error (RRMSE) histograms for six protocols, comparing the independent kinetics models from Lei et al. [14] to the identical kinetics models with voltage-clamp artefact. Each histogram represents the same 124 cells with a different protocol and RRMSE each time. Red markers indicate the best (*), median () and 90th percentile (#) RRMSE values for the independent kinetics model; green markers are the same cell prediction from the identical kinetics models. The median, 10th percentile and 90th percentile of the RRMSE values are shown in the electronic supplementary material, table S3. For each protocol, the raw traces for the identical kinetics model (green), the independent kinetics model (red) and data (blue) are shown, with the voltage-clamp above. Note that the currents are shown on different scales for each cell, to reveal the details of the traces. The same analysis applied to the remaining three protocols is shown in the electronic supplementary material, figure S7. Quantitatively, the two models show a similar RRMSE distribution for each protocol, with a slightly larger error on average in the fit for the identical kinetics (a), but a slightly lower error in predictions (b–f ). In particular, note how the errors seen in two of the cell-specific kinetics predictions (red traces) in (b) are corrected by the identical kinetics model (green). (Online version in colour.)

