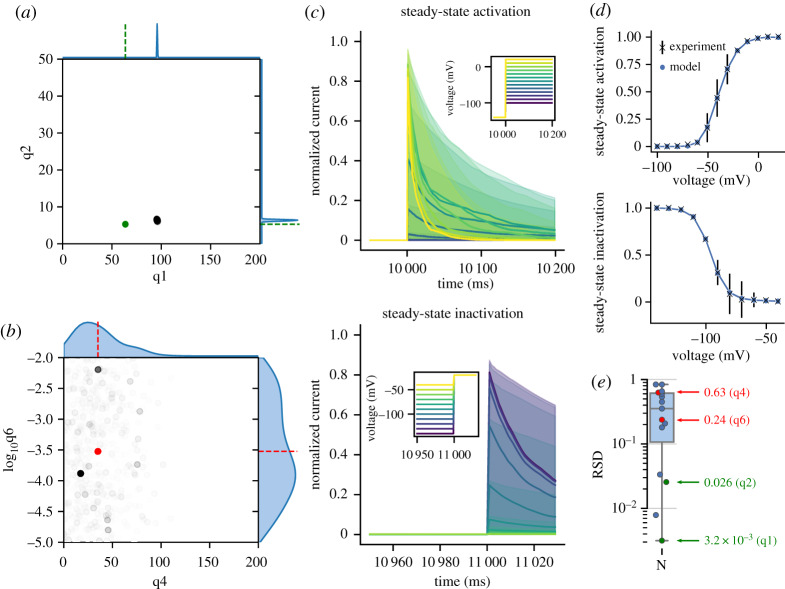
Figure 1.
(a,b) Examples of parameter posterior distributions from the N model of INa after calibration to the original dataset which only included steady-state data. Scatter plots show the population of posterior ABC particles with weights indicated by opacity. One-dimensional KDEs of each parameter posterior distribution are displayed along the corresponding axes. The original parameter values from the model are indicated as dots and dashed lines. (c) Normalized current traces of posterior model response to inset voltage protocol displayed as median line with shading indicating 89% HDPI from 100 samples from parameter posterior distributions. The high variability in decay rate is the result of no time constant data included in the dataset used for calibration. (d) Summary statistics generated from results in (c). (e) RSD values of all parameter posteriors with representative parameters from (a) and (b) highlighted. (Online version in colour.)

