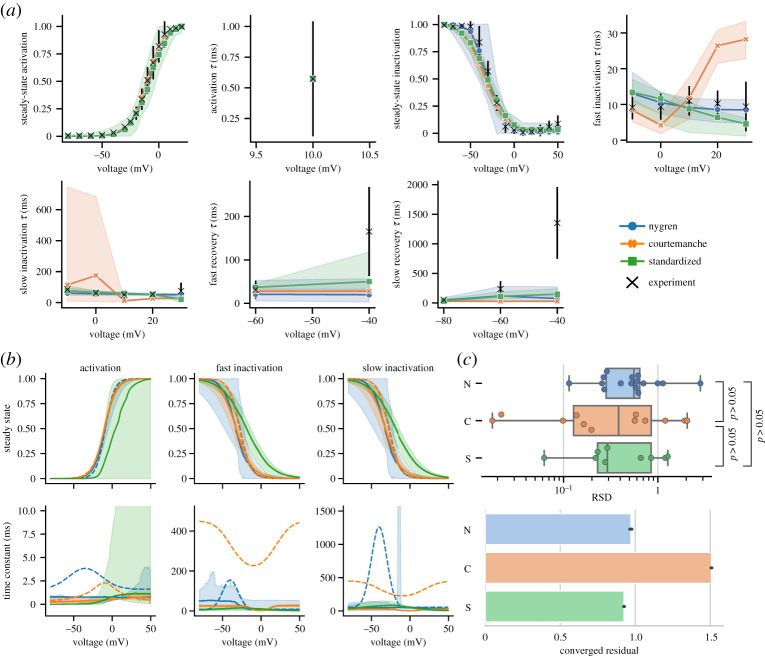
Figure 4.
(a) Results of calibrating ICaL models to the unified dataset. Plotted as described in figure 3. (b) Steady-state and time constant functions for each gate from the samples in (a). Dashed lines indicate published N and C models. (c) RSD of parameter posteriors (upper). Goodness of fit assessed by converged residuals from ABC (lower). (Online version in colour.)

