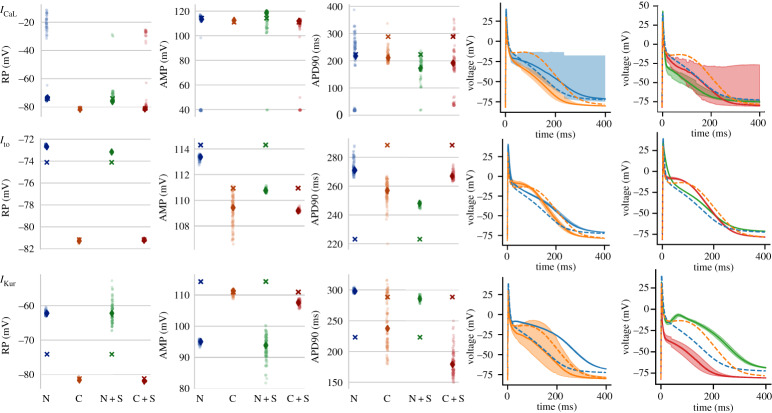
Figure 6.
Strip plots showing measurements of resting potential (RP), action potential amplitude (AMP) and AP duration to 90% repolarization (APD90) from APs elicited from the full N and C models. Crosses indicate values from the models run at published settings. Each point is a measurement from an AP generated from a sample from the posterior parameter distribution of the channel indicated. The diamond is the median of the samples. N: using N unified posterior distribution in the full N model, C: using C unified posterior distribution in the full C model, +S: indicates the standardized model replaced the corresponding channel in the full model and used the S posterior distribution. Line plots in the two rightmost columns display a summary of the AP traces in each case. Traces are displayed as median lines with shading representing 89% HDPI from 100 posterior samples. The published N and C models are plotted as dashed lines in all plots for comparison. (Online version in colour.)

