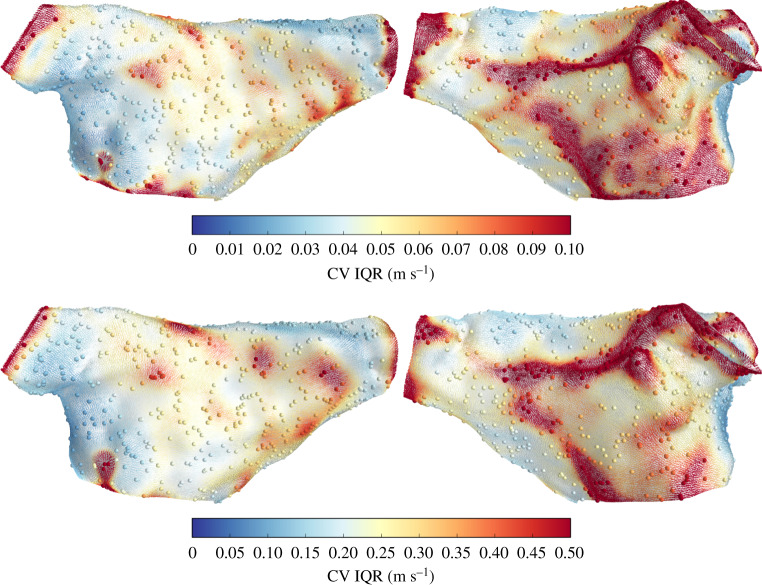
Figure 5.
CV vectors at face centroids coloured by CV magnitude interquartile range, for the predictions in figure 4. Note that the colour scales are different for each case, due to differences in prediction uncertainty for CV magnitude. (Online version in colour.)

