
Figure 1.
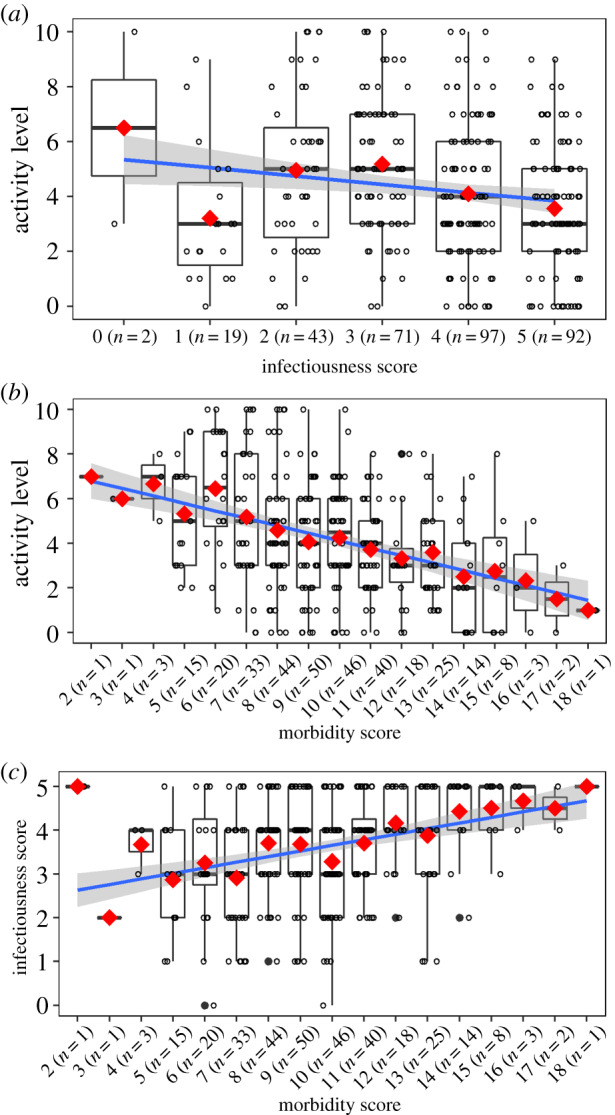
For all plots, the red diamonds indicate the mean and the solid blue line is the linear regression fit. The shaded area is the 95% confidence interval for the linear regression. (a) Activity level for each level of the infectiousness score. (b) Activity level for each level of the morbidity score. There are no patients with a morbidity score of 0, 1, 19, and 20. (c) Infectiousness score for each level of the morbidity score. (Online version in colour.)