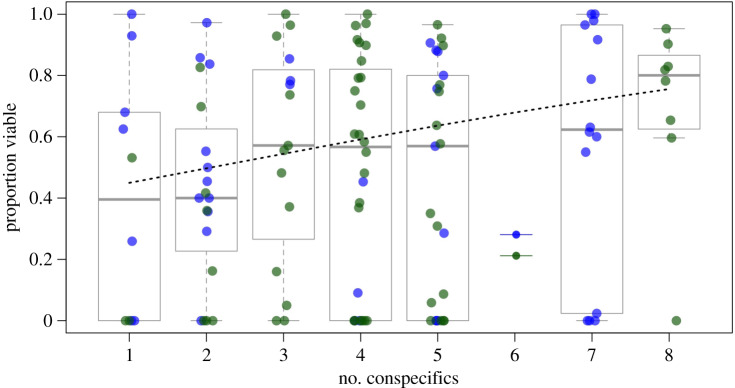
Figure 4.
Density-dependent seed viability of experimental migrants; points represent seed viability of individual plants; horizontal lines in boxplots represent median seed viability in local neighbourhoods with varying numbers of conspecifics; trend line follows median predictions from the best-fitting model (a species term was not included in this model, so only a single line is fit). (Online version in colour.)

