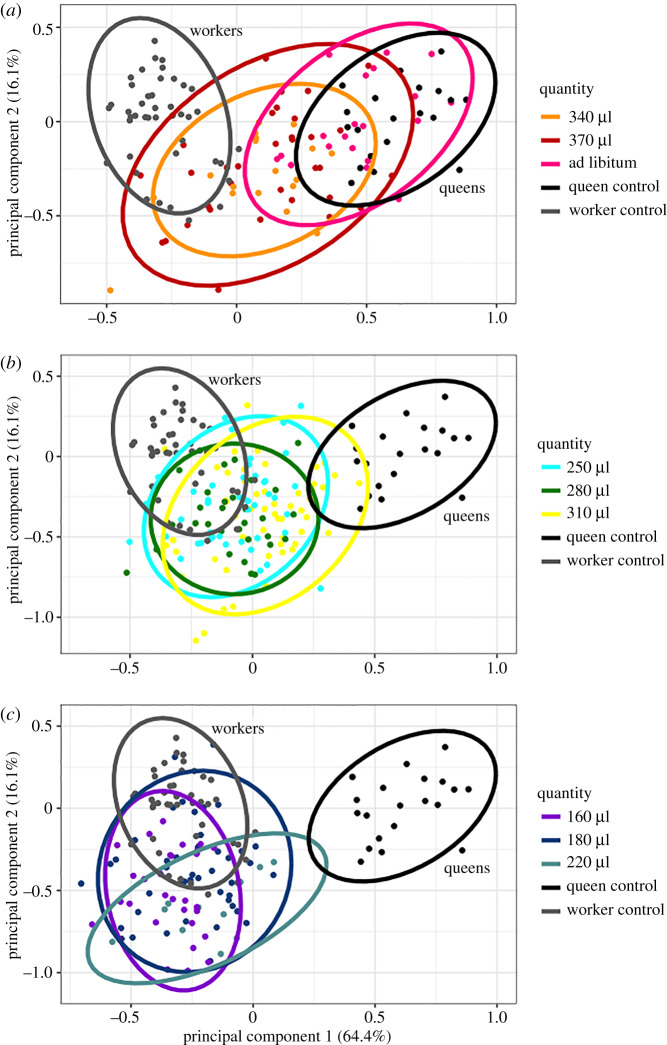
Figure 2.
Principal component analysis (PCA) on seven traits visualized by diet quantity. Hive-reared queens (queen reference) and workers (worker reference) populations were analysed to establish principal component 1 (64.4%) and principal component 2 (16.14%). In vitro reared bees were compared to those reference populations. Colours represent amount of food during the final larval stage. (a) Bees fed larger quantities (340 µl, 370 µl and ad libitum) of food. (b) Bees fed medium quantities of food (250–310 µl). (c) Bees fed low quantities of food (160–220 µl). Ellipses represent the 95% confidence interval. Sample sizes were: 160 µl = 29, 190 µl = 45, 220 µl = 11, 250 µl = 44, 280 µl = 30, 310 µl = 54, 340 µl = 18, 370 µl = 33, ad libitum = 20, queen reference = 20, worker reference = 43. (Online version in colour.)

