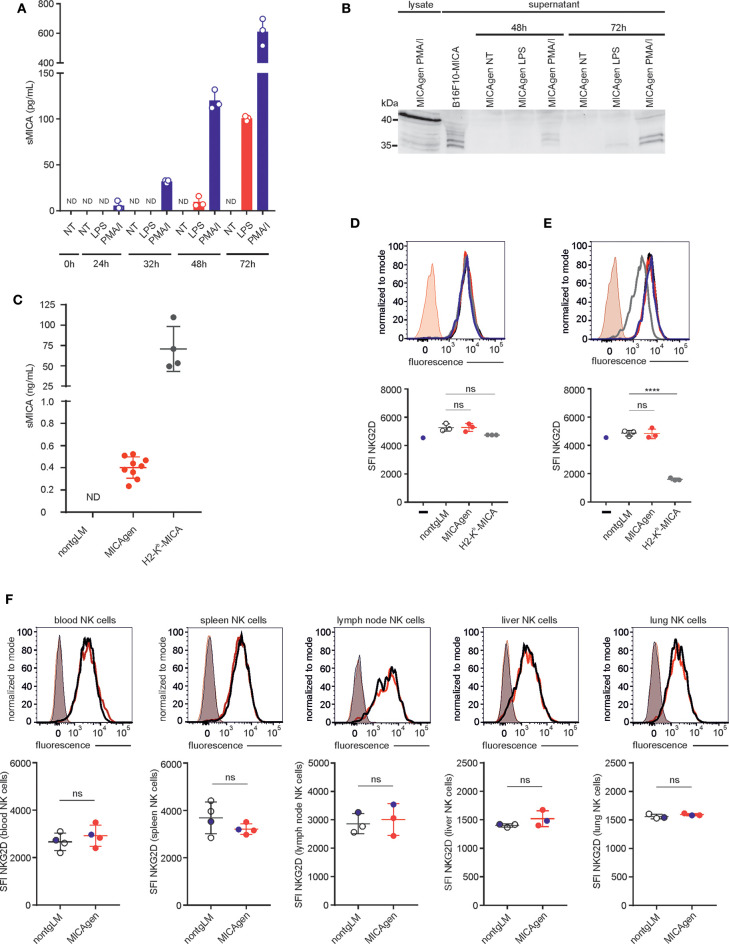
Figure 5.
Soluble shed MICA (sMICA) in plasma of MICAgen mice does not down-regulate NKG2D and is derived, at least in part, from hematopoietic cells. (A,B) Activated MICAgen splenocytes shed substantial amounts of sMICA. Freshly isolated splenocytes of MICAgen mice were treated in vitro with either lipopolysaccharide (LPS) or PMA plus ionomycin (PMA/I), or left untreated (NT) for various times. (A) Concentrations of sMICA in the respective culture supernatants were determined by a MICA-specific ELISA. Data from stimulations of splenocytes from three different mice are shown with mean and standard deviation. ND, not detectable. (B) Detection of sMICA in PNGaseF-digested culture supernatants of activated splenocytes by immunoblotting using mAb BAMO1. For comparison, lysates of PMA/I-stimulated splenocytes (full-length MICA) and supernatants of B16F10-MICA transductants (sMICA) were analyzed. (C) Plasma of MICAgen mice contains substantial amounts (~0.4 ng/ml) of sMICA but markedly less than H2-Kb-MICA mice (~75 ng/ml). Plasma of nontgLM, as well as of MICAgen and H2-Kb-MICA mice, was analyzed for sMICA by ELISA. Each symbol represents sMICA levels of an individual mouse. ND, not detectable. Mean and standard deviation are shown. (D,E) NKG2D surface expression on NK cells after (E) direct co-culture with splenocytes from MICAgen, or H2-Kb-MICA mice, or nontgLM, respectively, or (D) co-culture with such splenocytes in a transwell setting. Carboxyfluorescein succinimidyl ester (CFSE) pre-labeled splenic NK cells from nontgLM (D) placed in permeable transwell inserts into cultures of splenocytes from nontgLM, or MICAgen, or H2-Kb-MICA mice (E) or directly co-cultured with splenocytes from nontgLM, or MICAgen, or H2-Kb-MICA mice, respectively. After 24 h culture, NK cells were stained with anti-NKG2D mAb and analyzed by flow cytometry with gates set on CFSE+ CD3−NK1.1+ cells. Representative stainings of NK cells co-cultured with splenocytes from nontgLM (black line), MICAgen (red line), and H2-Kb-MICA (gray line) were overlayed. NKG2D expression of NK cells cultured without splenocytes (blue line) is shown for control. Isotype controls stainings (rat IgG1k-BV421) of NK cells co-cultured with MICAgen splenocytes also overlayed. Mean and standard deviation are shown. Each dot represents an individual mouse. One-way ANOVA test was performed (****p < 0.0001, ns = not significant). (F) NKG2D expression on blood or tissue NK cells of MICAgen mice is not reduced. Upper panels show representative NKG2D stainings of NK cells isolated from various organs (blood, spleen, lymph node, liver, and lung) of nontgLM (black line) or MICAgen mice (red line), overlayed with isotype control stainings (rat IgG1k-BV421) (shaded). Lower panels show compilation of data from three to four mice per group. Mean and standard deviation are shown. Unpaired T-test was performed (ns = not significant). The data shown in upper panels are marked as blue dots.

