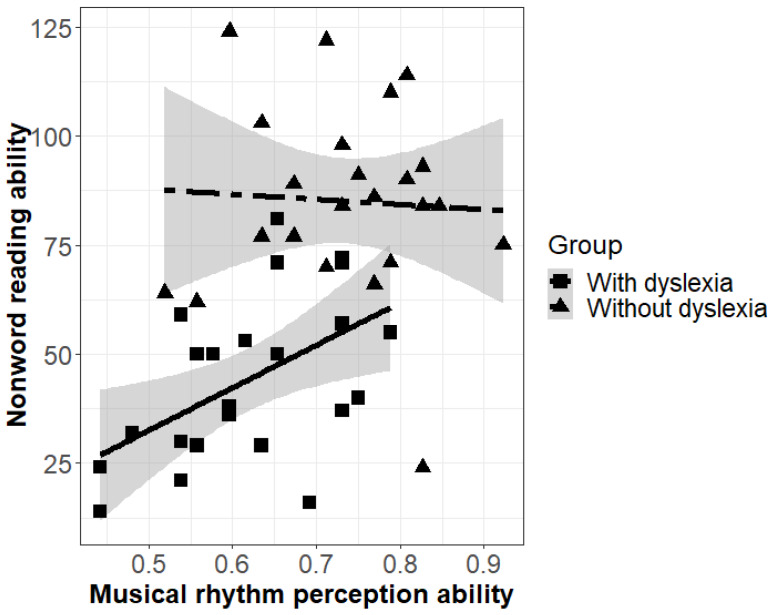
Figure 3.
Linear regression lines reflecting the association between nonword reading ability (Salzburger Lese- und Rechtschreibtests (SLRT) scores) and musical rhythm perception ability (Musical Ear Test (MET) scores) split by group, shades indicate confidence intervals, rectangles (with dyslexia) and triangles (without dyslexia) the individuals’ averages.

