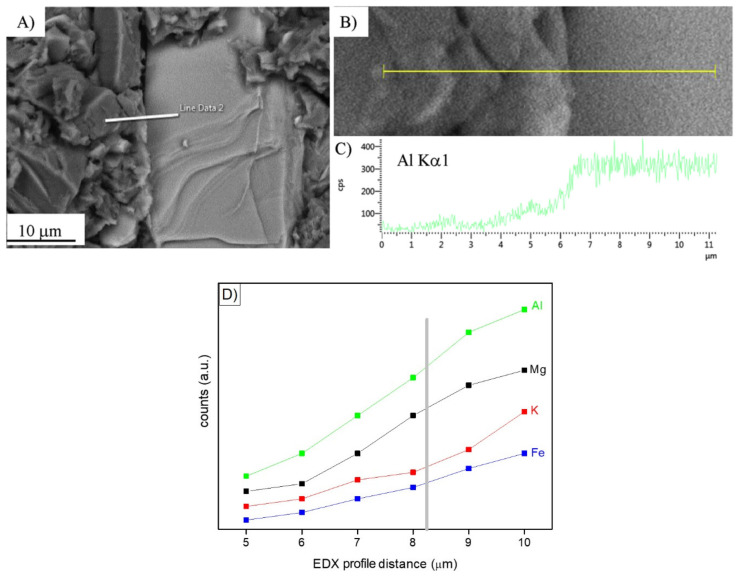
Figure 3.
(A,B): Field emission scanning electron microscopy (FESEM) micrographs at different magnifications of a biotite grain in a one-year-aged sample; (C): Energy dispersive X-ray spectroscopy (EDX) profile related to Al Kα1 along the line shown in (A,B). Reprinted from [46] under the license n. 4792980067658. In (D), the Al, Mg, K, and Fe profile evolution at the grain–matrix interface is highlighted (unpublished image by the authors).

