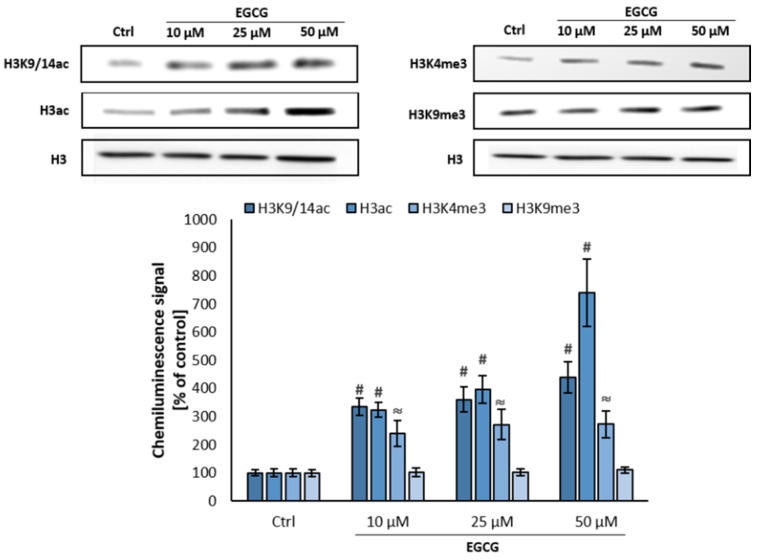
Figure 8.
Effect of multiple EGCG treatment on acetylation and methylation profile of selected lysine residues in HMEC-1. The cells we treated with the green tea polyphenol every 24 h for 5 days. Whole cell extracts were used for the immunoblotting analysis. The presented western blots are representative of three independent experiments and the chart visualizes densitometry of the chemiluminescence signal calculated vs. loading control and vs. control. The data are presented as mean ± SD; n = 3; ≈ p< 0.01, # p < 0.01, control vs. treated, ANOVA and post hoc analysis by Tukey’s test.

