Figure 2.
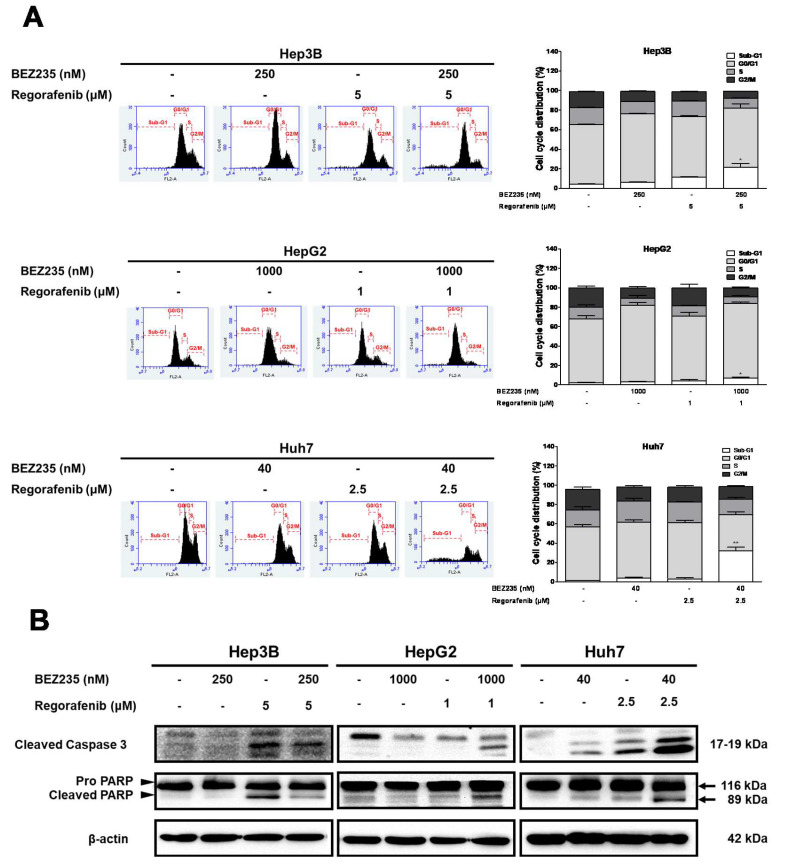
The regorafenib-induced apoptosis in HCC cells increases upon treatment with BEZ235. The flow cytometry analysis of cell cycle profiles in HCC cells treated with BEZ235 and regorafenib for 48 h (A). The Western blot analysis indicating the expression pattern of cleaved caspase-3 and cleaved PARP (B). Data are represented as mean ± S.D. * p < 0.05, and ** p < 0.01 versus untreated control, and BEZ235 or regorafenib alone group.

