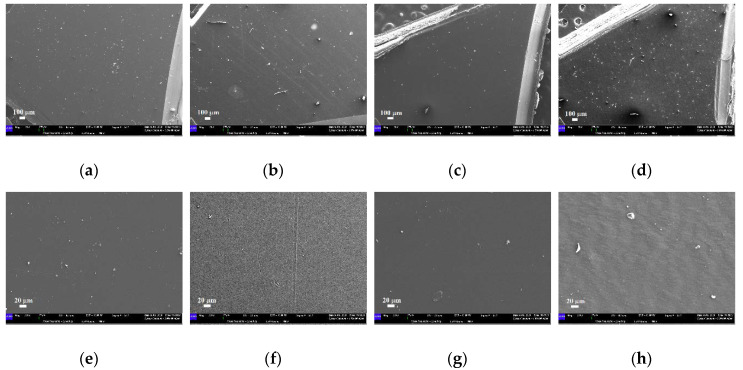
Figure 13.
SEM micrographs of the samples immersed in water at 37 °C: (a–e) EK disk (magnifications 80× and 500×, respectively); (b–f) EP disk (magnifications 80× and 500×, respectively); (c–g) GA disk (magnifications 80× and 500×, respectively); (d–h) ZN disk (magnifications 80× and 500×, respectively).

