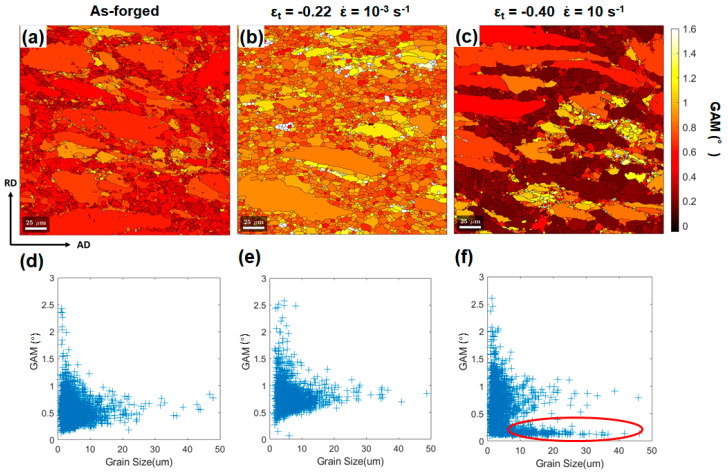
Figure 7.
GAM maps for the microstructures in: (a) the as-forged state, deformed state with εt of −0.40 (b) at of 10 s−1 and (c) at of 10−3 s−1. The corresponding plots of grain size versus the GAM value are plotted in (d–f). The yellow ellipse in (f) highlights the occurrence of grown equiaxed grains with low GAM value and large grain size.

