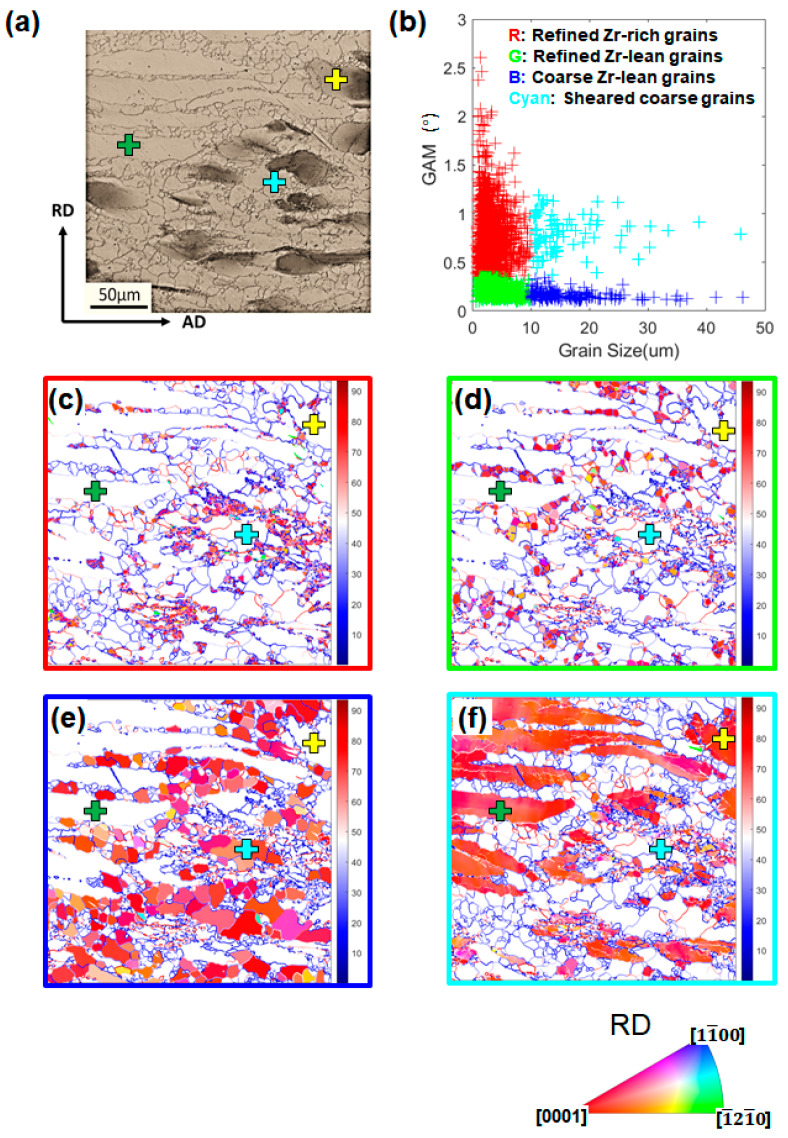
Figure 9.
Grain partition approach based on the EBSD map for the sample deformed to a true strain of −0.69 at 10 s−1: (a) optical micrograph of the ROI, (b) plot of grain size versus GAM value for all the grains in the ROI. Grains were partitioned on a basis of both the GAM value (threshold value = 0.35°) and grain size (threshold value = 10 μm). Four groups are represented by red/green/blue/cyan color schemes. IPF maps for the same ROI in (a) showing (c) Zr-rich refined grains as the red group, (d) Zr-lean refined grains as the green group, (e) Zr-lean grown equiaxed grains as the blue group, and (f) sheared coarse grains as the cyan group. (The crosses on a and c–f are for the reader to position feature grains for correlation).

