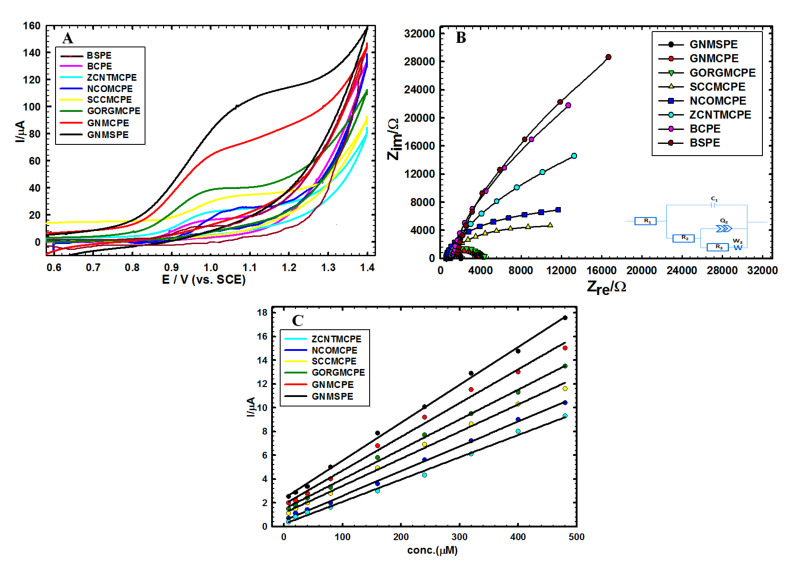
Figure A3.
(A) CVs of 1.0 mM Moxi in 0.01 M B-R (pH = 7.0) and scan rate 50 mV s−1 measured on the various investigated electrodes as presented in the experimental section. (B) The corresponding Nyquist plots for the studied sensors (bottom right inset: the best fitted equivalent circuit). (C) The analytical curves obtained from performing DPV measurements at scan rate 10 mV s−1 with sensing platforms ZCNTMCPE, NCOMCPE, SCCMCPE, GORGMCPE, GNMCPE and GNMSPE.

