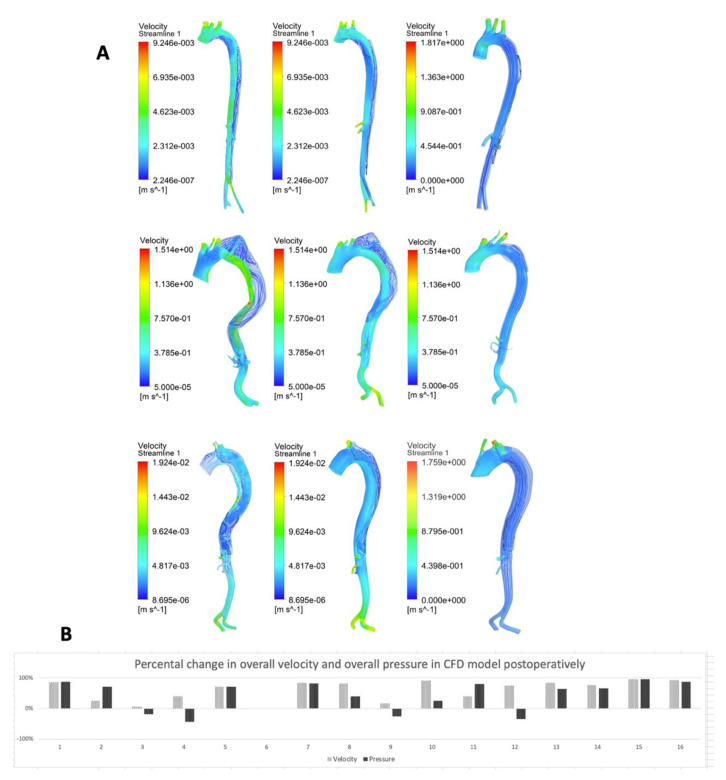
Figure 3.
(A) Velocity maps of computational fluid dynamics (CFD) analyses of the primary three symptomatic chronic type B aortic dissection cases with the longest follow-up obtained from CT scans, preoperative, postoperative, and at the latest follow-up. All geometries comprised aortic branches and true and false lumens. Pre-op indicates preoperative; post-op, postoperative; FU, follow-up. (B) This figure presents the alterations in overall velocity and overall pressure calculated in the CFD models postoperatively per case.

