Figure 3.
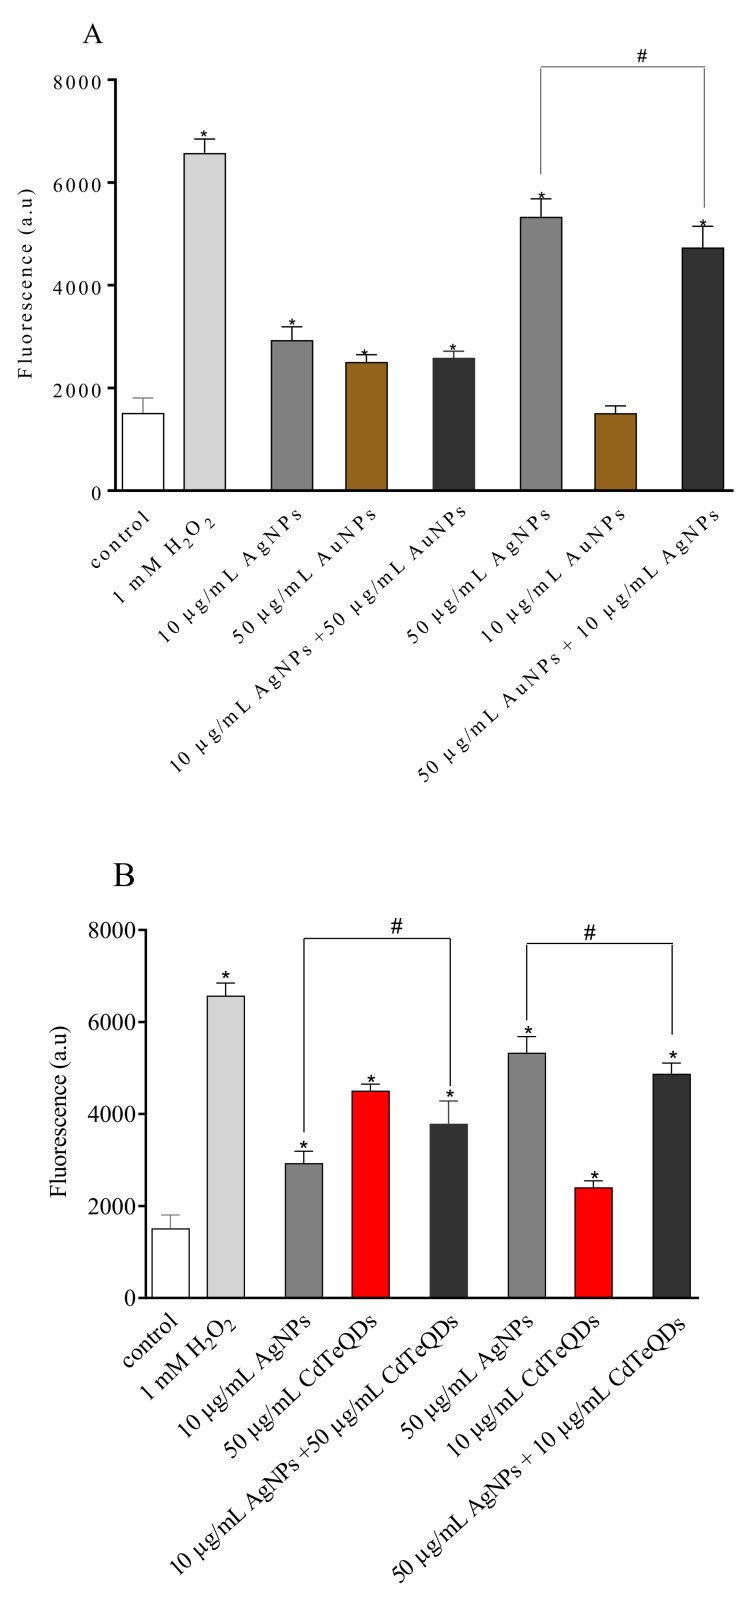
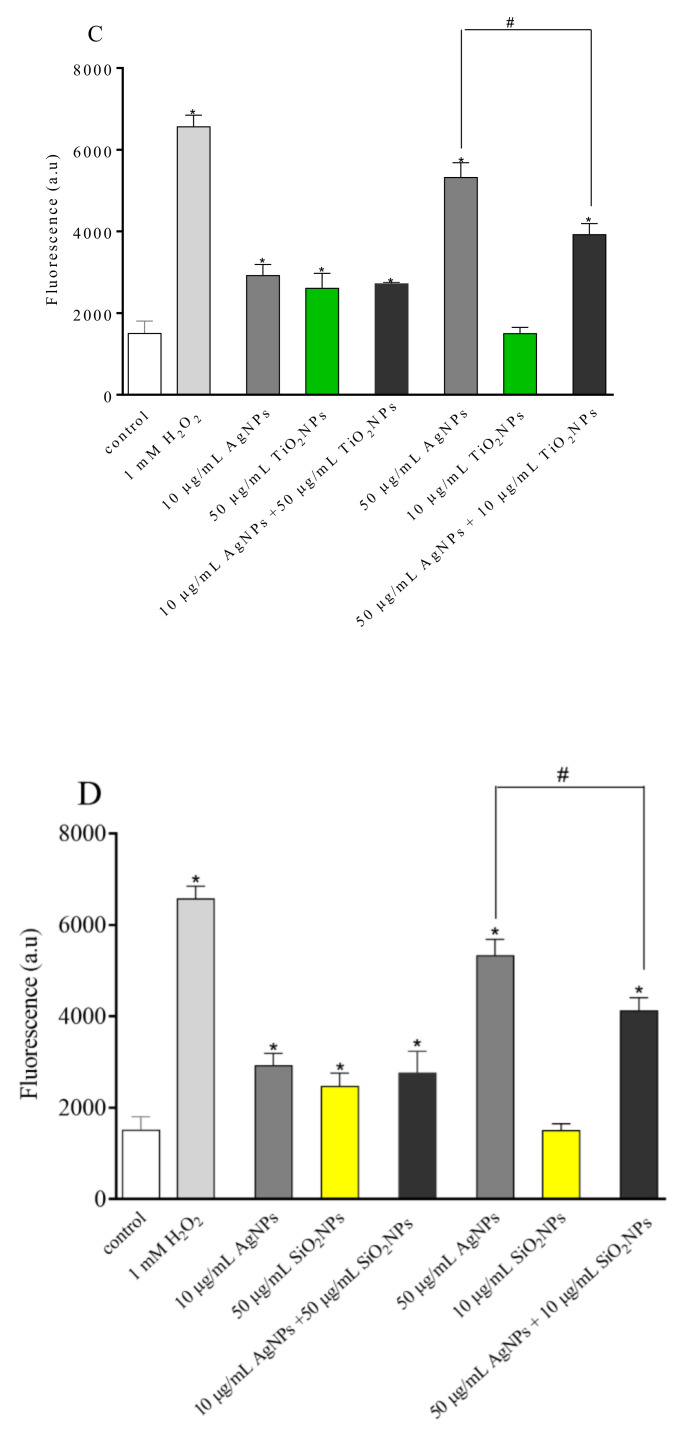
Generation of reactive oxygen species (ROS) in HepG2 cells treated with single NPs or the combination of AgNPs with AuNPs (A), CdTeQDs (B), TiO2NPs (C), and SiO2NPs (D). H2O2 in a concentration of 1 mM served as a positive control. Mean ± SD, n = 3. * denotes a statistically significant difference from the unexposed control, P < 0.05. # denotes a statistically significant difference between ROS generated by the combination of NPs and the highest value observed for the single NP in this combination, P < 0.05.


