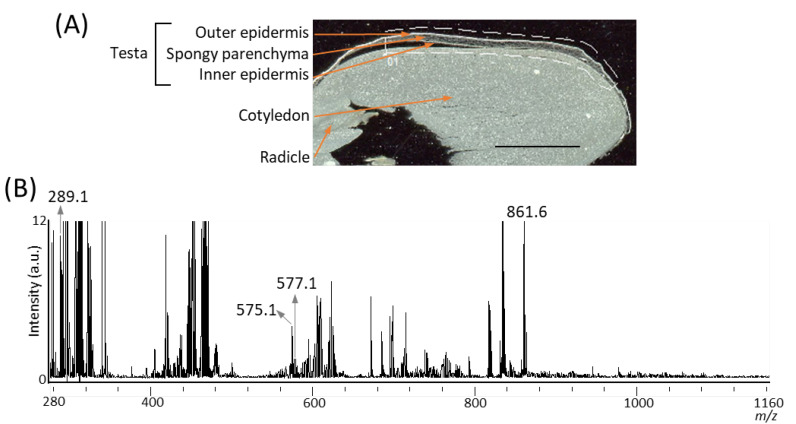
Figure 2.
Matrix assisted laser desorption/ionization (MALDI)-mass spectrometry imaging (MSI) of a peanut longitudinal section. (A) Optical image of a peanut fruit section before MALDI–MSI measurement. The dotted white line shows the analyzed region. Scale bar = 5 mm. (B) Mass spectrum obtained from the peanut section.

