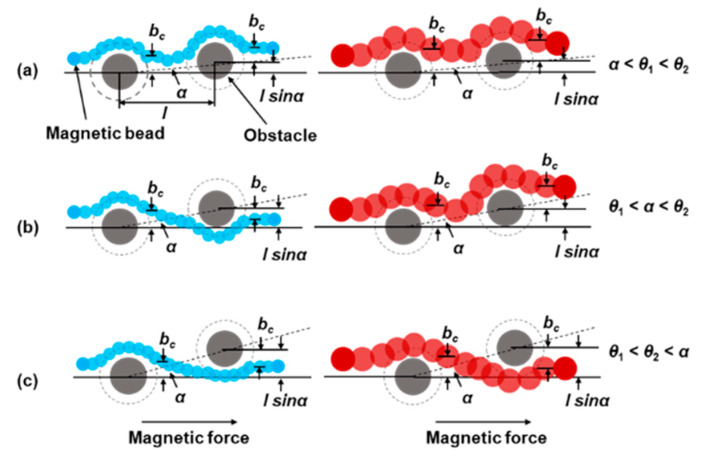
Figure 3.
Schematic diagram of the trajectories of particles of two different sizes at different forcing angles. The driving angles are (a) α < θ1< θ2, (b) θ1 < α < θ2 and (c) θ1 < θ2 < α, respectively. We assume that the critical angle (θ2) of large particles is greater than the critical angle (θ1) of small particles. The bc and l sinα at different forcing angles were given in the schematic diagram.

