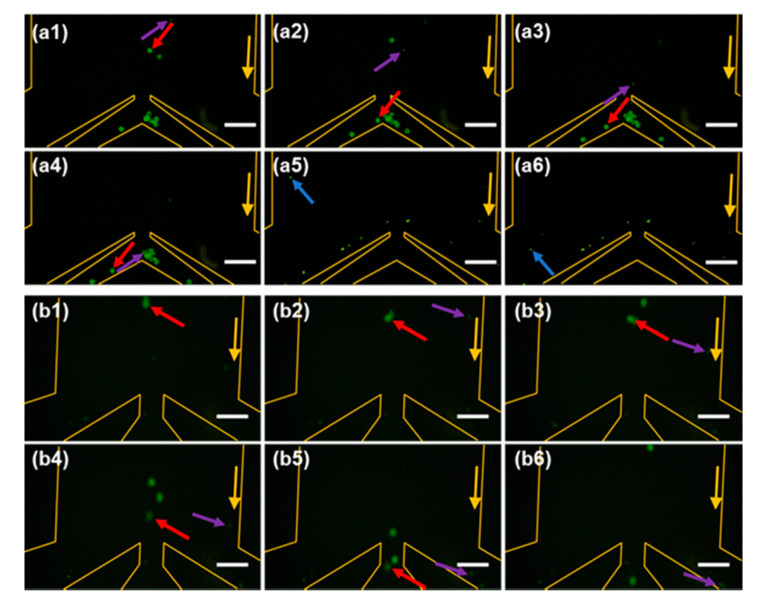
Figure 8.
Snapshots of the movement of immunomagnetic beads at the outlet at the first stage (a1–a6) and the second stage (b1–b6). The 10 μm, 20 μm and 40 μm magnetic beads are indicated by blue, purple and red arrows respectively. Yellow arrows indicate the flow direction. The time interval is approximately 2 s. Scale bar is 200 μm.

