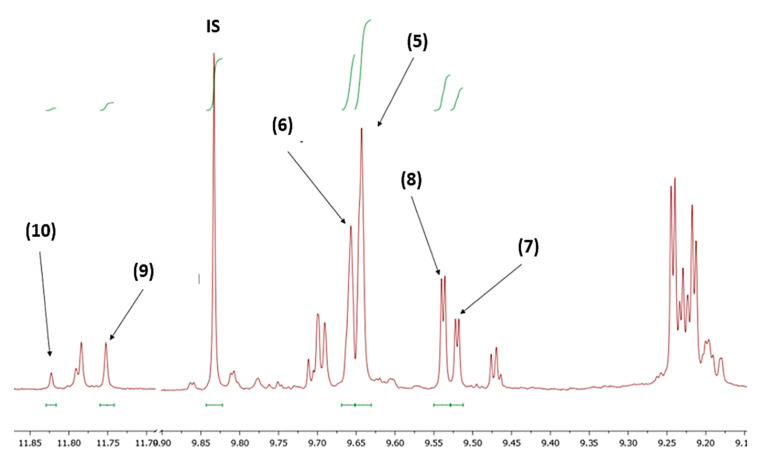
Figure 10.
Example of NMR spectrum (400 MHz) of the aldehydic region of a typical olive oil extract depicting the selected peaks that were used for integration: oleocanthal (5), oleacein (6), ligstroside aglycon monoaldehydic form (7), oleuropein aglycon monoaldehydic form (8) oleokoronal (9), oleomissional (10). IS: internal standard (syringaldehyde).

