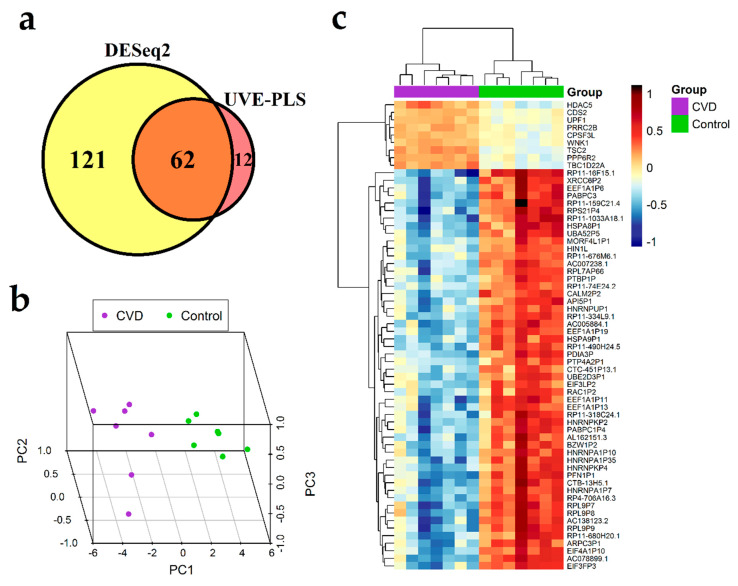
Figure 3.
Results of differential expression analysis of genes in group of seven patients with chronic venous disease (CVD) vs. seven healthy controls group (Control). (a) Venn diagram presenting comparison of two gene sets: the set of 183 genes received from DESeq2 analysis with p < 0.00001 and the set of 74 informative genes indicated by Uninformative Variable Elimination by Partial Least Squares (UVE-PLS) analysis. Sixty-two genes were common for both sets of genes. 3D Principal Component Analysis (PCA) plot (b) and heatmap with Euclidean clustering (c) show differential expression of common 62 genes in CVD and Control groups.

