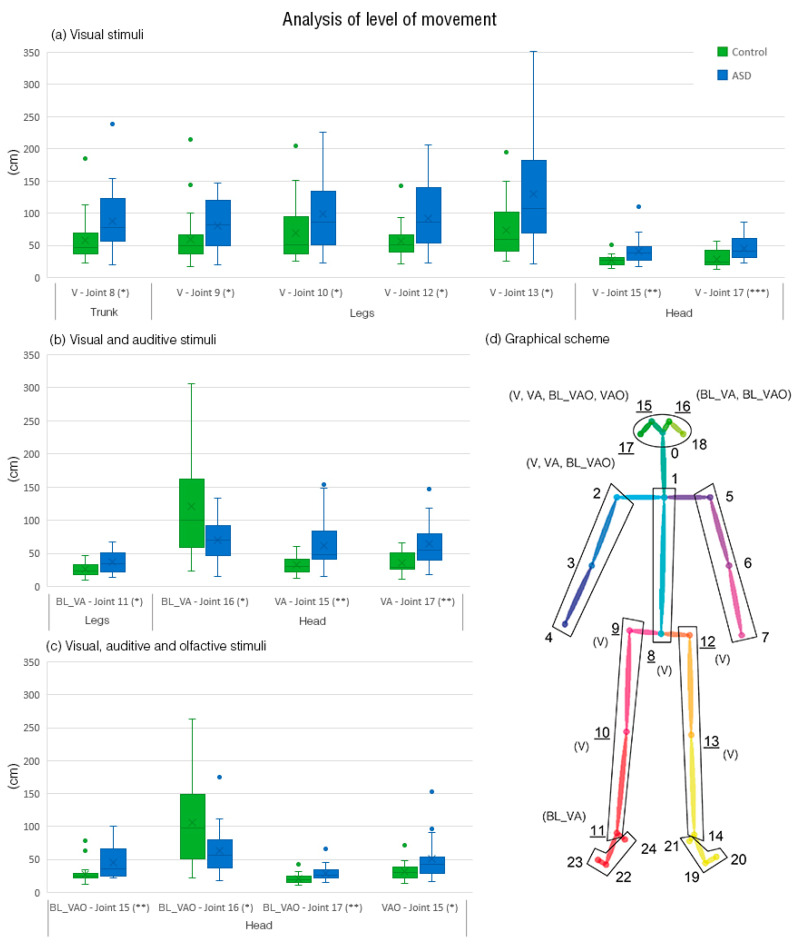
Figure 4.
Analysis of the level of movement of joints that presents statistical differences: (a) Boxplot of joints in visual stimuli; (b) boxplot of joints in visual and auditory stimuli; (c) boxplot of joints in visual, auditory, and olfactory stimuli; (d) scheme of the joints including the stimuli where differences are found. Note. * p < 0.05. ** p < 0.01. *** p < 0.001.

