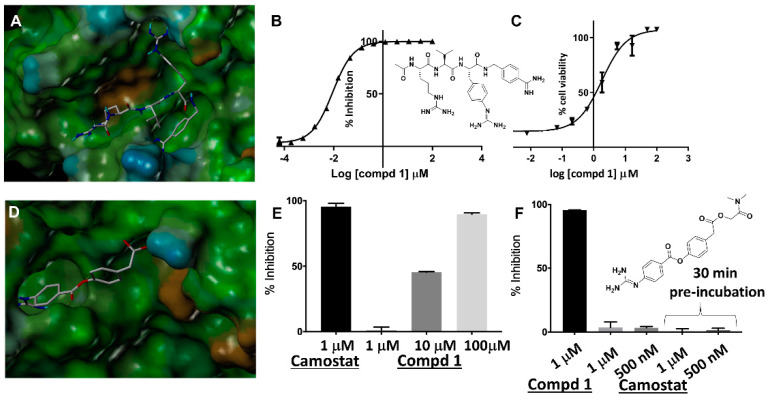
Figure 2.
Characterization of the protease inhibitors. (A) Docked geometry of compound 1 into the 3D structure of furin. The docked pose was obtained based on the X-ray structure of similar agents in complex with furin (PDB-ID 4OMC) [30]. The docked geometry was obtained based on the structure of the complex using Sybyl (Cetara, St. Louis) and visualized using MOLCAD (surface representation color-coded according to lipophilic potential: brown more lipophilic; cyan less lipophilic). (B) Chemical structure of compound 1 and dose response curve for inhibition of furin by compound 1. (C) Dose response curves for the protection of RAW macrophages by lethal factor/protective antigen (LF/PA) apoptosis by compound 1. (D) Docked geometry of camostat in a modeled structure of TMPRSS2 catalytic domain (obtained via Swiss3D model and bovine trypsin as template, PDB ID 3MFJ). (E) Inhibition of bovine trypsin by camostat, as a reference, and compound 1 at the indicated conditions. (F) Chemical structure of camostat and inhibition of furin by compound 1 and camostat at the indicated conditions.

