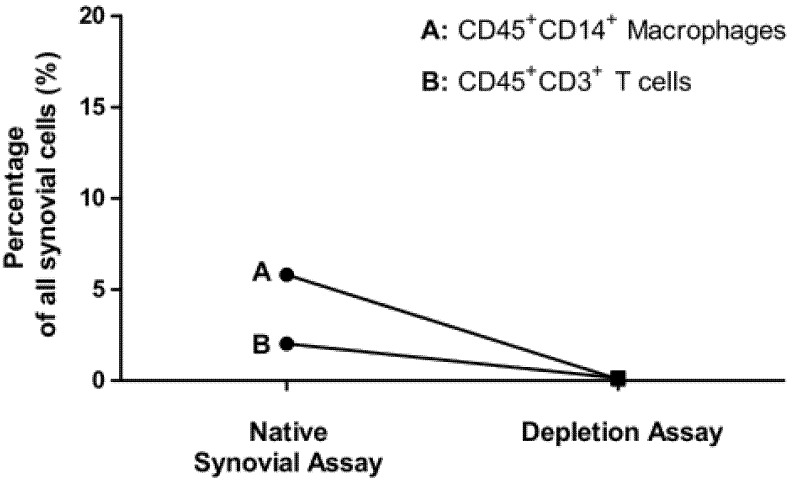
Figure 4.
Depletion of synovial macrophages and T cells shown by flow cytometry analyses. Display of the mean values of: Percentage of CD45+CD14+ macrophages (A) and CD45+CD3+ T cells (B) on all living synovial cells in the samples of the native synovial assays and macrophages (n = 10) and T cell depletion assays (n = 12).

