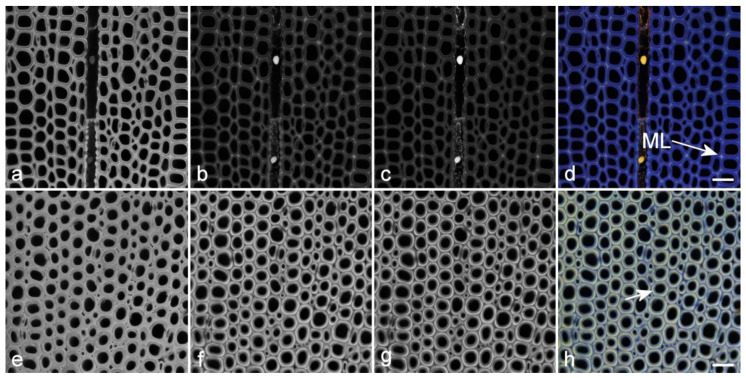
Figure 10.
Spectral imaging of lignin autofluorescence using sequential excitation with emission ranges centered around the λmax for each excitation wavelength at a constant gain. Excitation at 355 nm (UV) (a,e), 488 nm (blue) (b,f) and 561 nm (green) (c,g). Color overlays are shown in (d,h). (a–d) Normal pine wood showing monochromatic lignin fluorescence at UV, blue and green excitations. Scale bar = 30 µm. (e,h) Pine compression wood showing the same range of excitation and emission highlighting the change in lignin distribution in this wood type compared to normal wood. UV excitation shows the same intensity, whereas blue and green excitations are significantly brighter compared to normal wood (images of normal and compression wood were acquired at the same gain). Blue and green excitation clearly show the more lignified middle lamella (ML) and outer secondary cell wall (short arrow) in the two specimens respectively. Scale bar = 30 µm.

