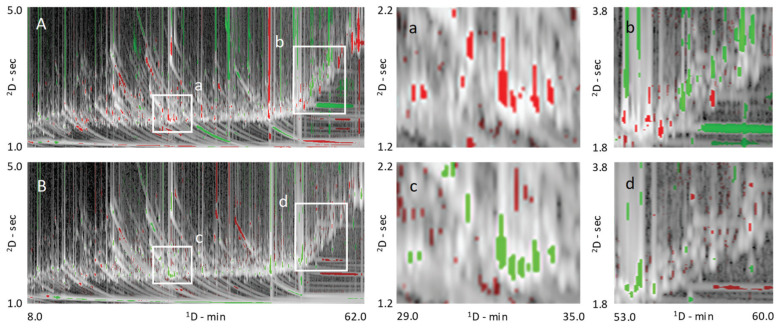
Figure 4.
Pair-wise comparison based on visual features fingerprinting [7], the comparative visualization is rendered with a colorized fuzzy difference. Pixels brightness indicates the magnitude of the absolute response; pixels hue indicates whether the analyzed image (i.e., 2015_YUN_HS in (A) or 2015_FUJ_LS in (B)–green) or reference image (i.e., 2015_FUJ_HS for both visualizations-red) has the higher response value. Pixel saturation (color vs. grey tones) indicates the magnitude of the difference between the analyzed and reference images, with grey indicating equal pixel values and bold colors indicating large differences. Enlarged areas, corresponding to white rectangles, highlight absolute compositional differences for monosaccharides (a/c) and of some secondary metabolites belonging to the chlorogenic acid and flavan-3-ol classes (b/d).

