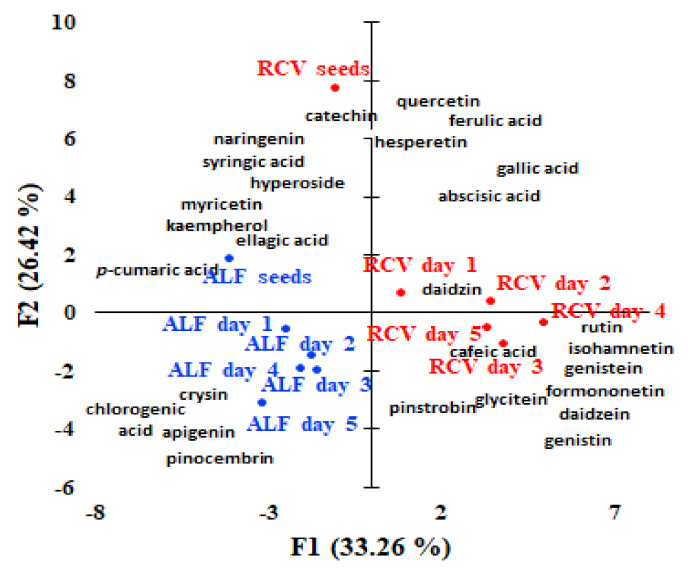
Figure 3.
Bi-plot of the principal components PC1 and PC2 resulted from the PCA analysis with normalized Quatrimax rotation data of the polyphenols’ concentrations quantified and the samples (alfalfa and red clover sprouts samples coded as: RCV — red clover, ALF — alfalfa, s — seeds, day 1-first day of germination, day 2-second day of germination, day 3-third day of germination, day 4-fourth day of germination, and day 5-fifth day of germination).

