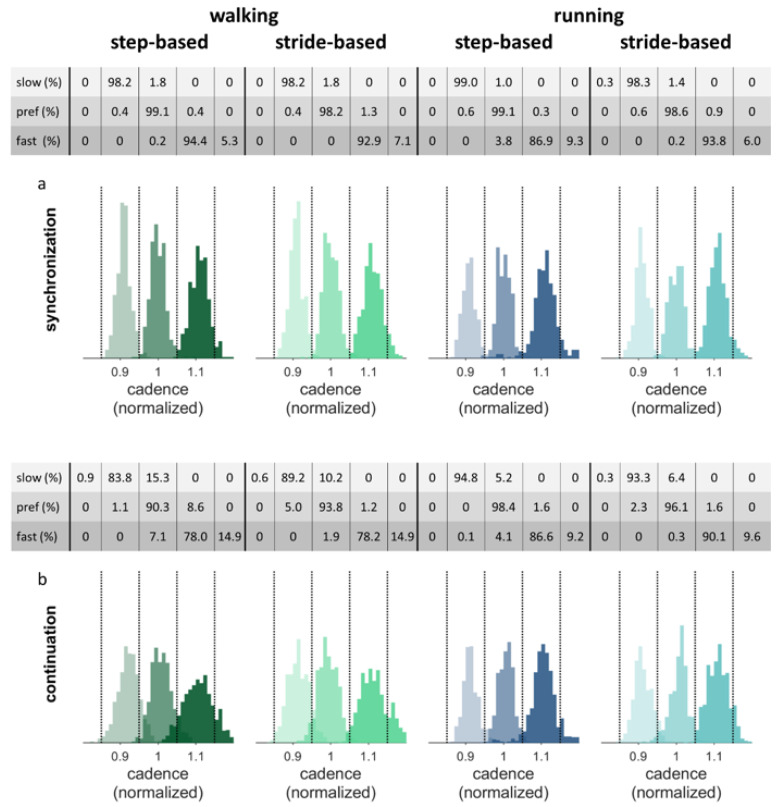
Figure 8.
Histograms of the normalized cadence. (a) Synchronization phase. (b) Continuation phase. Vertical dotted lines represent the borders of the ranges around the slow (0.9), preferred (1.0) and fast (1.1) frequencies. The percentages of cadences falling in each frequency range are displayed above the figure for the three pacing frequencies separately. The data displayed belongs to the nine participants included in the constant error analysis for walking. As some of these participants did not synchronize in all conditions, displayed histograms were based on N = 7 for running with preferred step-based, and slow and preferred stride-based pacing conditions and N = 6 for the running with slow step-based pacing conditions.

