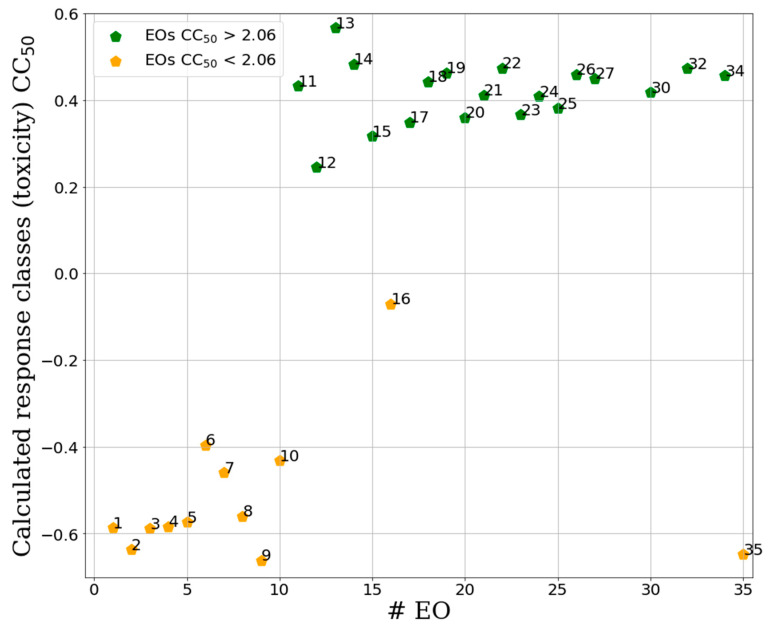
Figure 5.
Separation between active and inactive samples for the binary CC50-PLS-DA classification model. Green samples are the non-toxic class, orange the toxic. On the y-axis are reported the calculated response for the toxic classis calculated by the PLS-DA technique (X score × Y weights) for each EO [24] (Table 2). Samples at the top of the plot were assigned to be a non-toxic class while those at the bottom were classified as toxic.

