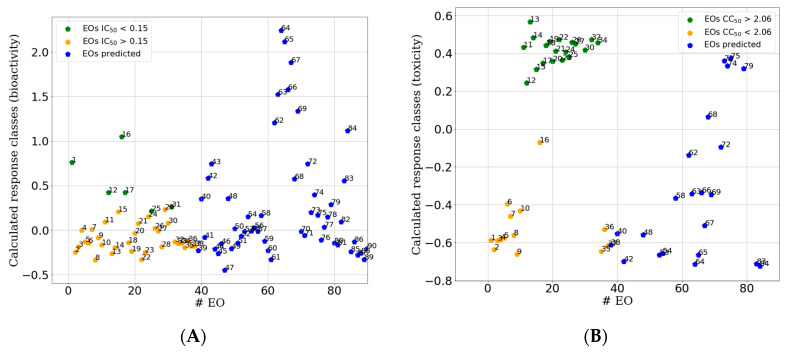
Figure 10.
Sample plots for external test set (blue points) predicted by the IC50-PLS-DA classification (A) and by the CC50-PLS-DA classification. On the y-axis are reported the calculated response bioactivity classes (A) and toxicity class (B) by the PLS-DA model (X score × Y weights) [24] for all predicted EOs (test set, Table 2). For comparison in the plot are also reported the points relative to the training set (green and orange points, Figure 5).

