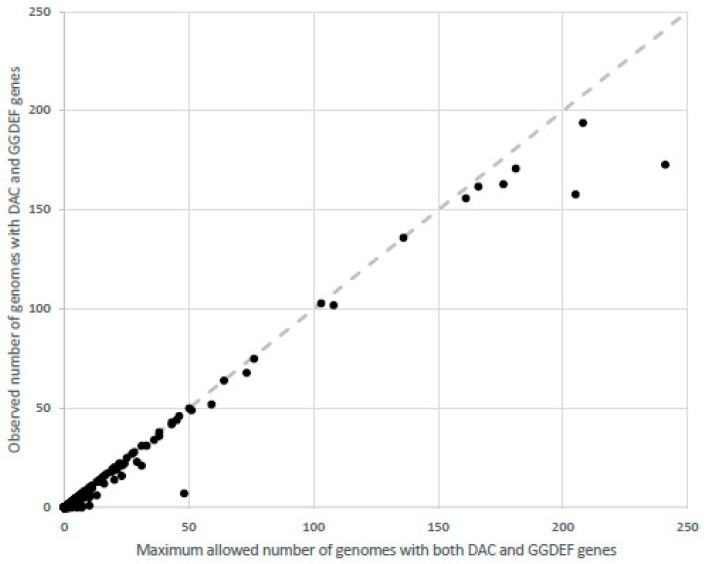
Figure 9.
Lack of anti-correlation in the distribution of DAC and GGDEF genes per prokaryotic clades. Each dot represents a prokaryotic class, such as Gammaproteobacteria or Bacilli, as defined in the NCBI’s Taxonomy Database. For each class, the number of genomes harboring at least one DAC and one GGDEF gene and the number of genomes harboring both was calculated. If, for a given class, we consider the number of genomes with DACs and the number of genomes with GGDEF, the smallest of these numbers is the maximum number of genomes that could, in principle, carry both genes. That number is seen on the horizontal axis while the actual number of genomes carrying both genes is on the y-axis. These numbers are very close to the diagonal line, indicating that, in most cases, if members of a given lineage are carrying both DAC and GGDEF, they tend to keep both genes, instead of having to choose between them.

