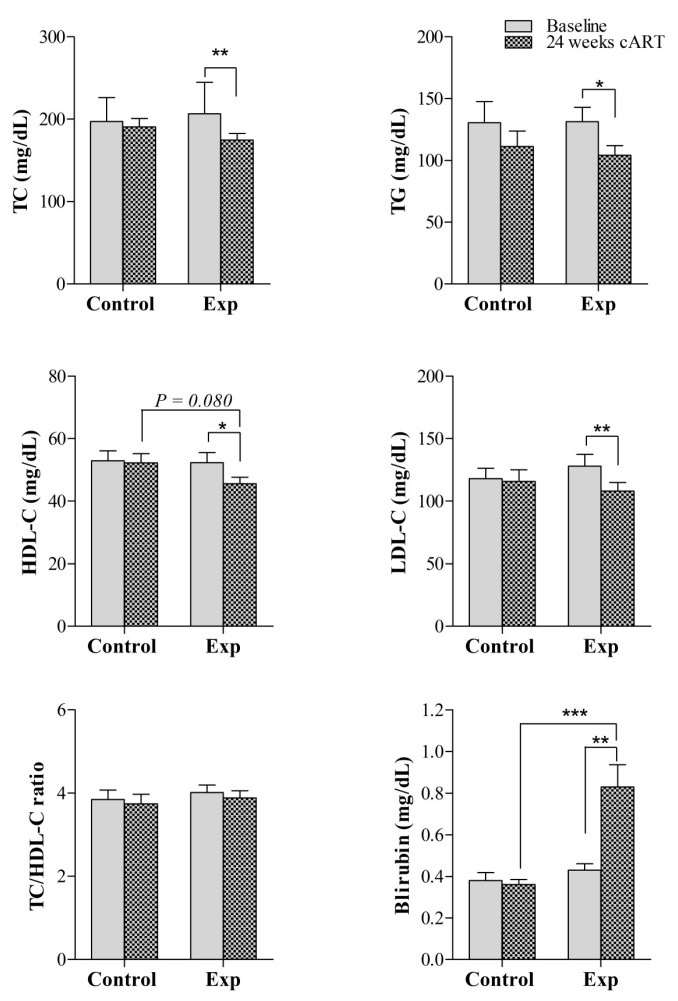
Figure 2.
Evaluation of the effect of switching to RPV versus maintaining EFV both co-formulated with FTC/TDF on conventional clinical parameters at baseline and at 24 weeks of follow-up. Data are presented as the mean ± SEM. *p-value < 0.05, **p-value < 0.01, and *** p-value < 0.001. Abbreviations: Exp, experimental group; RPV, rilpivirine; TC, total cholesterol; TG, total triglycerides; LDL-c: low-density lipoprotein cholesterol; HDL-c: high-density lipoprotein cholesterol.

